Interested?
Want to know more
or are you interested in a demo?
Please feel free to contact us.

Want to know more
or are you interested in a demo?
Please feel free to contact us.
Do you always want to have relevant information and insights that are of value to your organization? Geodan has datasets and services that can help you prevent or resolve an incident or crisis and that make your work - for example planning and policy - easier.
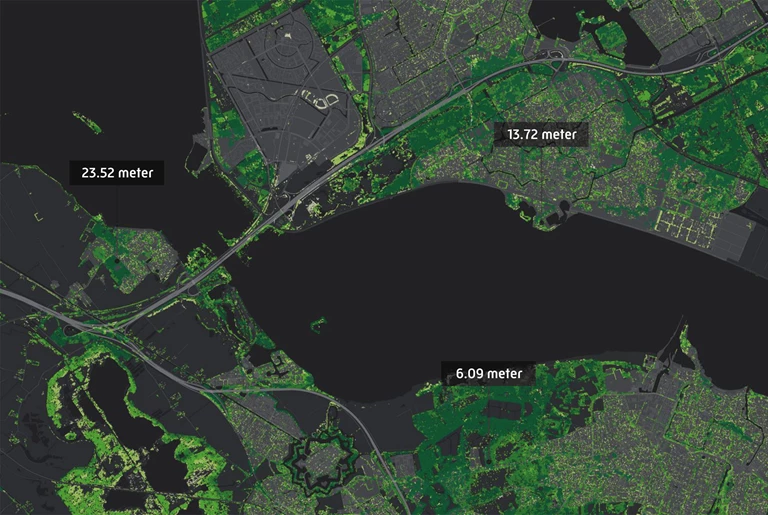
Data provides valuable insights, such as the number of stories in a particular building or what type of roof that building has. You can use this information to answer a wide range of questions and our various datasets bring that knowledge within arm’s reach. We have datasets related to spatial planning, for instance, as well as data that will help you analyse flood risks, but we can also be of service to you in the field of 3D visualizations.
Tree registry
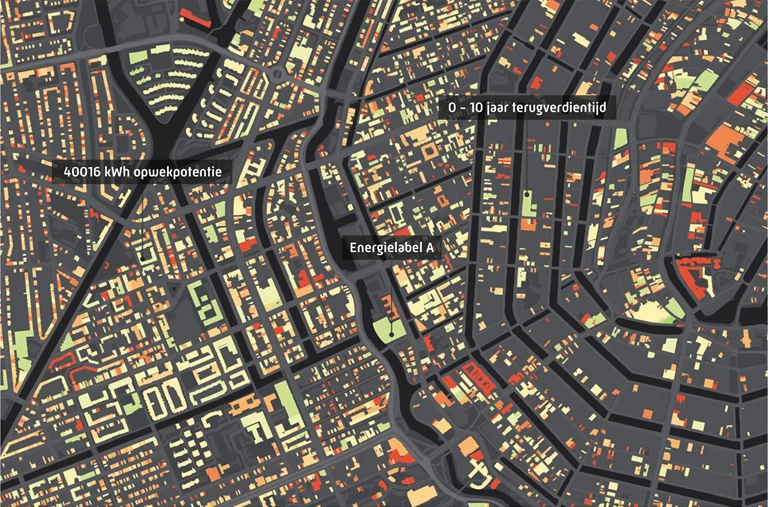
Energy data
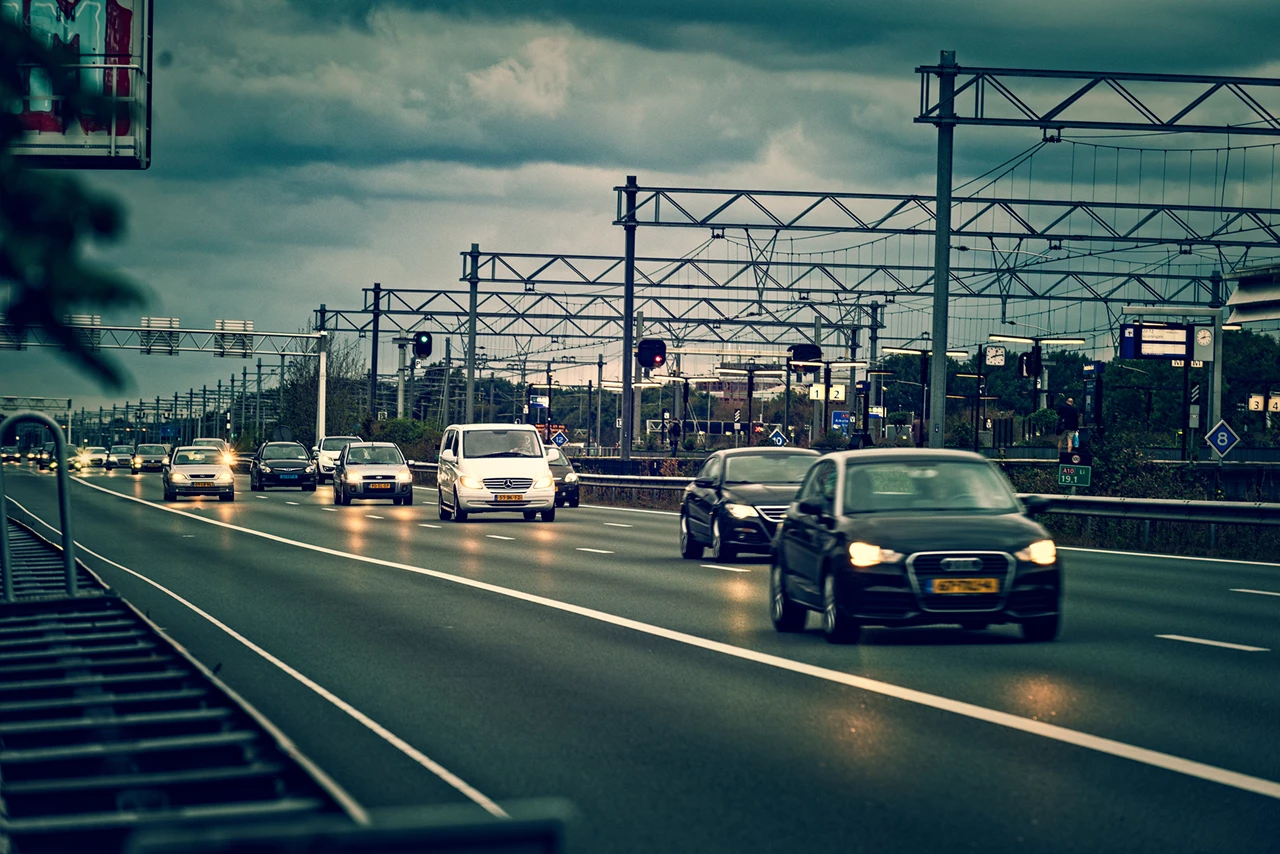
To limit traffic congestion, damaged cars must be removed from the road as quickly as possible after an incident. AIM (Arrival time system Incident Management) monitors the duration of the operation and Bergerview visualizes the location and status of the salvagers involved.
Geodan offers handy tools for the Central government sector.