Producten&diensten Datasets en services Bouw en infra
Bert Scholten

Interested?

Bert Scholten

Want to know more or are you interested in a demo? Please feel free to contact me.  

Email me

Water boards

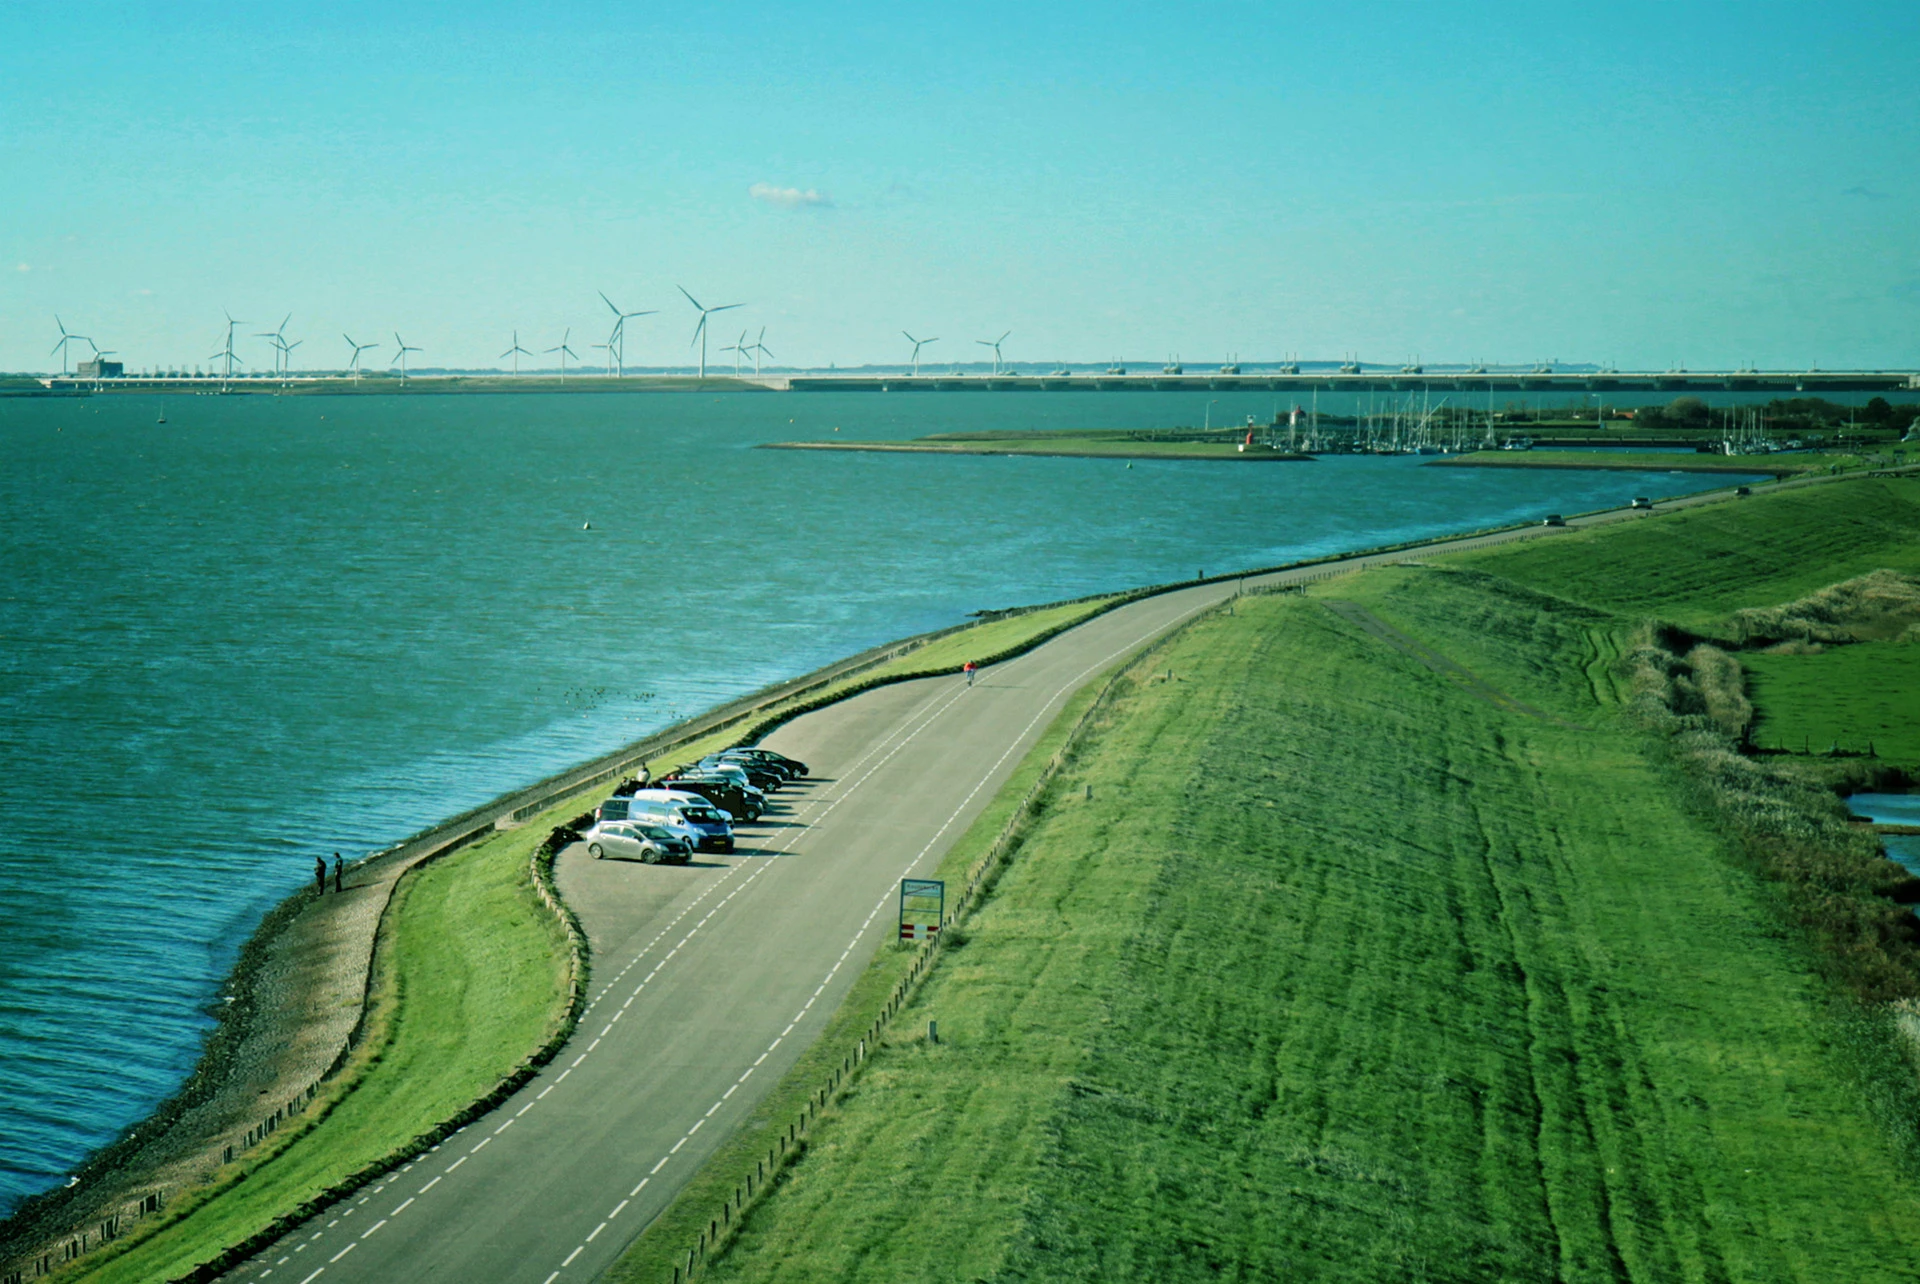
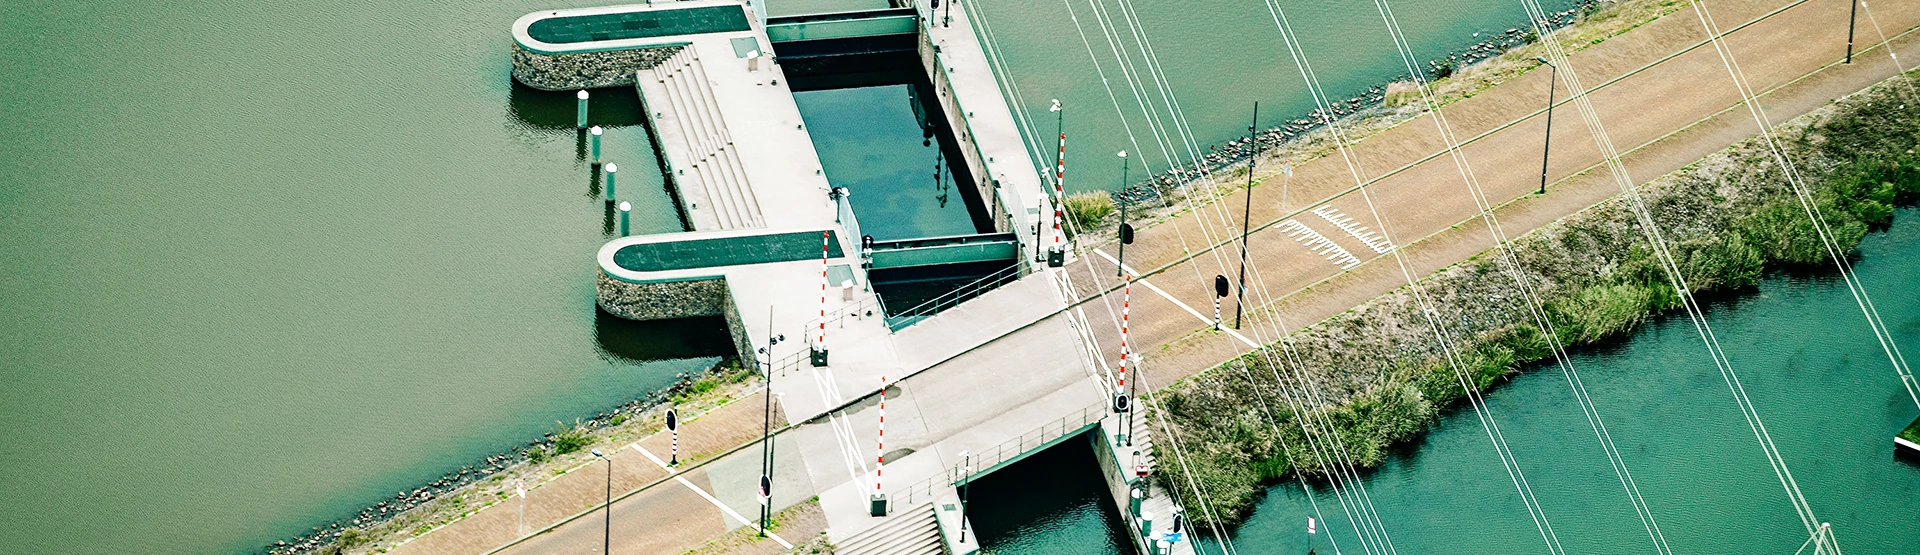
Always have relevant information and insights that are of value to your organization. Looking to find out more about maximum water levels in a specific area and whether water storage might be necessary? Our water management datasets and services will get you the information you need. Developed specially for your company. Discover how location intelligence can improve your business and business processes.


Dataset: Zip code maps

At different levels

Geodan always supplies up-to-date versions of the zip code map, at all levels and in various versions. These maps can be used in a GIS, BI systems, or in your own (web) application and ensure that you can always carry out geographical analyses, whether you’re looking to display your turnover per zip code area, visualize your service area, or map out districts. You can take your pick from a 'basic version' or more complete versions, with, for example, the associated residence and province codes. Easy to link to other data, including Netherlands Statistics datasets.

Service: Spatial Queries

Fire away!

If you’re looking to find the characteristics of a certain selected area, just use our Spatial Queries service to learn more about the number of residents and households or specific home characteristics. That’s useful information to have during a crisis, for instance, because it’ll tell you exactly how many people you’ll have to evacuate in case of an emergency and help you to find them as well. You can easily filter the data based on location, route or a selected area, and you can export all data to a spreadsheet application for processing at the push of a button. Handy for reports or evaluations!

SERVICE: MAP LAYERS

Map library

Geodan offers a standard map library with data for GeodanMaps customers, including administrative layouts, such as zip code and municipal boundaries, as well as all addresses and buildings, building types, energy data, and demographic data at the zip-code level. Aside from that, it’s easy to add your own data for a handy, complete overview.

Dataset: Zip code-area relation table

In the neighborhood

Looking for more information about the demographic characteristics of a certain area or neighborhood? Simply link your own zip-code-level data to neighborhoods and districts known to Statistics Netherlands. We’ll get you all the characteristics that are available at that level and provide all data in a single, handy overview.

Dataset: Tree registry

A ‘treemendous’ dataset

The Tree Registry is full of information about all the trees in the Netherlands, including crown width, height and tree type. This dataset lets you discover which plants & trees are located near bodies of water, which is important for maintenance, or in case of low water and flood risk.

DATASET: distance matrix

Accurate travel times

In our distance matrix, you’ll find all travel times and distances to and from all zip codes in the Netherlands. The standard version is available for cars at the zip code 4 and zip code 5 level, but custom tables are also possible for other modes of transportation or other countries, for instance. Ideal for use in HRM systems to determine travel expenses, or to determine travel times and distances between different areas in the logistics sector.

Service: Geocoding

Always up-to-date

GeodanMaps lets you code your own geodata using an Excel file. From zip codes and addresses to coordinates, neighborhoods, and areas; they are all converted into separate map layers, allowing you to visualize your own data on a map and gain new insights. This information is also easy to share with others.


Service: Notifications

We’ll let you know

If the water level rises above or dips below a certain level, use our notification service to inform all the necessary employees in no time.


Pros

  • Custom dataset

    Receive a custom-made dataset, adjusted to your company’s wishes.
  • Combine datasets

    Combine your own data with datasets that are relevant for your sector
  • Visual analyses

    Make better decisions with the help of visual analyses
Case:

Salvaging cars on time

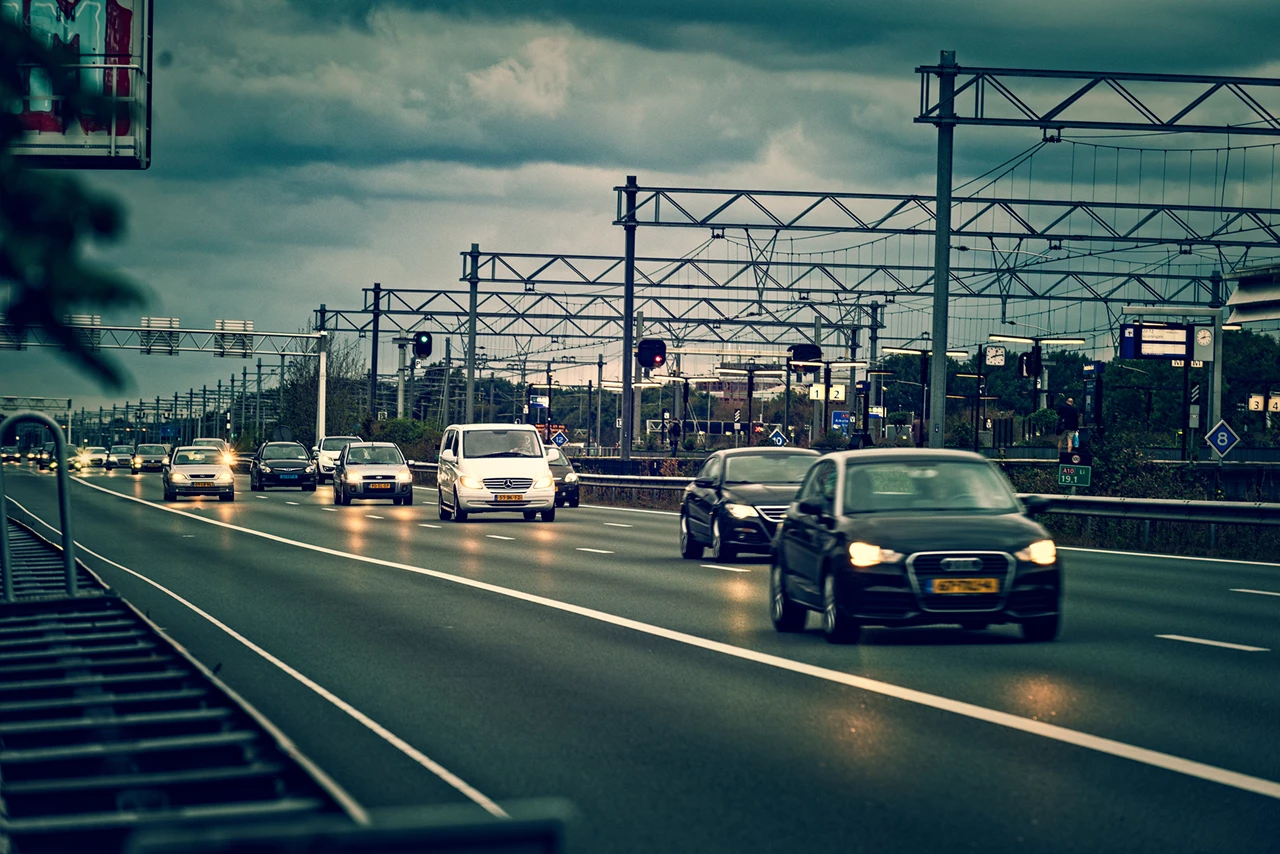
To limit traffic congestion, damaged cars must be removed from the road as quickly as possible after an incident. AIM (Arrival time system Incident Management) monitors the duration of the operation and Bergerview visualizes the location and status of the salvagers involved.


case - Aanrijdtijdensysteem Incident Management
Products and services

Solutions

Geodan offers handy tools for the water boards sector.

All products
Crisis situations are resolved better and more quickly when real-time information is made available to all parties involved. Clearly, on one platform.
Geodans 3D Subsurface literally and figuratively makes the subsurface transparent, viewable and accessible, and the measures to be implemented become transparent.